Cardinality Profiling for Categorical Columns
Distinct values matter more than you think in catching data quality gaps.

Cardinality is a simple idea that most quality tools still get wrong: it's the count of distinct values in a column, full stop. Not row count, not the percentage of nulls, not some derived completeness score. A table with ten million rows and a status column holding only four unique strings has a cardinality of four for that column, and that number, on its own, tells you almost nothing. What matters is the cardinality ratio, distinct values divided by total rows, because that ratio is what separates a column that behaves like a category from one that behaves like an identifier.
Three tiers do most of the work here. Low cardinality means a small, bounded domain, things like status codes, region flags, or leave types, where the ratio sits close to zero and the number of valid values is knowable in advance. High cardinality means a large, effectively unbounded domain, user IDs or session IDs, where the ratio climbs but duplicates still occur. Unique cardinality means every value is distinct, a ratio of exactly 1.0, which is what you'd expect from a primary key. Getting a column's tier wrong upstream cascades into bad encoding decisions, bad joins, and bad assumptions about what "normal" looks like.
Categorical columns need their own profiling logic because the standard toolkit, mean, standard deviation, interquartile range, was built for numbers. None of those statistics have any purchase on a column full of strings. An arXiv preprint on data-centric profiling makes this point explicit: quality defects in categorical and string-typed columns are effectively invisible to numeric-focused profiling, because there's no distribution to compute an IQR against. So a corrupted category value can sit in production for months while every numeric health check passes clean.
How a cardinality profile surfaces domain violations and invalid values
Low-cardinality columns imply something powerful: a closed, enumerable domain. If a column is supposed to hold one of three or four values, that constraint is testable, and cardinality profiling is what makes it explicit rather than assumed.
The detection pattern is almost embarrassingly simple. Count the distinct values, enumerate them, and compare the list against the known-valid set; any value outside that set is an anomaly, full stop, no bespoke rule required. Any value outside that set is an anomaly, full stop, no bespoke rule required. Take an order_status column whose valid domain is {pending, shipped, delivered}. A profile that returns four distinct values instead of three, with "unknown" appearing as the fourth, has just caught a domain violation that a numeric check would sail right past. No regex needed, no custom validation logic, just a count and a comparison.
The same logic extends to referential integrity. Comparing the distinct count of a foreign key column against the distinct count of the referenced primary key column exposes orphaned records, the classic case being a foreign key with more distinct values than the primary key it's supposed to reference. That mismatch means somewhere in the pipeline, records point to keys that no longer exist, or never did.
Cardinality drift: tracking distinct-value counts over time as a pipeline health signal
A one-time profile catches what's already broken. Tracking cardinality over time catches what's about to break before it causes downstream failures, while a one-time profile only catches what's already broken.
Domain expansion, uniqueness degradation, and domain collapse are three drift patterns to watch closely. Domain expansion happens when a new categorical value shows up, a new leave type gets added to an HR system, a new product status gets introduced, a new region code appears in a sales feed, and the pipeline logic downstream hasn't been updated to handle it. A new categorical value that appears without an update to downstream pipeline logic typically produces a NULL, or a silent fallback to some default value. Domain collapse is the mirror image: values that should keep appearing simply vanish, an effect visible when an upstream system change or a filtering bug is quietly dropping records. Uniqueness degradation is the one that should worry engineers most, because it means a column that's supposed to be a unique key starts producing duplicates, and the cardinality ratio drops below 1.0 without anyone touching the schema.
The silent failure mechanism behind domain expansion deserves particular attention. When a pipeline encounters a categorical value it has no mapping for, it doesn't usually throw an error, it just defaults, and defaults are where damage hides. Sales get attributed to "Unknown Customer." Regional reports come in looking understated because a new region code isn't being aggregated correctly. Machine learning models ingest those NULLs as training signal, treating an engineering gap as if it were real data. None of this trips an alarm unless something is actually watching the distinct-value count change shape over time. That's the argument for observability platforms that track statistical properties of data values, cardinality among them, and alert on shifts. A majority of data and analytics leaders (53% in one recent tally) have already put some form of data observability in place, which suggests the industry has largely accepted that periodic manual review isn't enough anymore.
Categorical columns are structurally invisible to the most common sampling approaches
Exhaustive profiling of a billion-row table is slow, sometimes prohibitively so, and that's the practical reason progressive sampling has become the default workaround. But the sampling method you use makes categorical defects visible or hides them entirely, and this is where a lot of profiling pipelines quietly fail without anyone noticing.
A paper titled "Data Quality Profiling at Scale with Progressive Sampling: A Benchmark for Data-Centric AI Pipelines" lays out the mechanism. Proxy-guided sampling methods, the kind that chase statistical proxies like IQR to decide where to sample next, are built around numeric outlier detection. They have no mechanism for evaluating categorical or string-typed columns, so those columns simply don't factor into the sampling decision. The sampler optimizes for the wrong target and never notices.
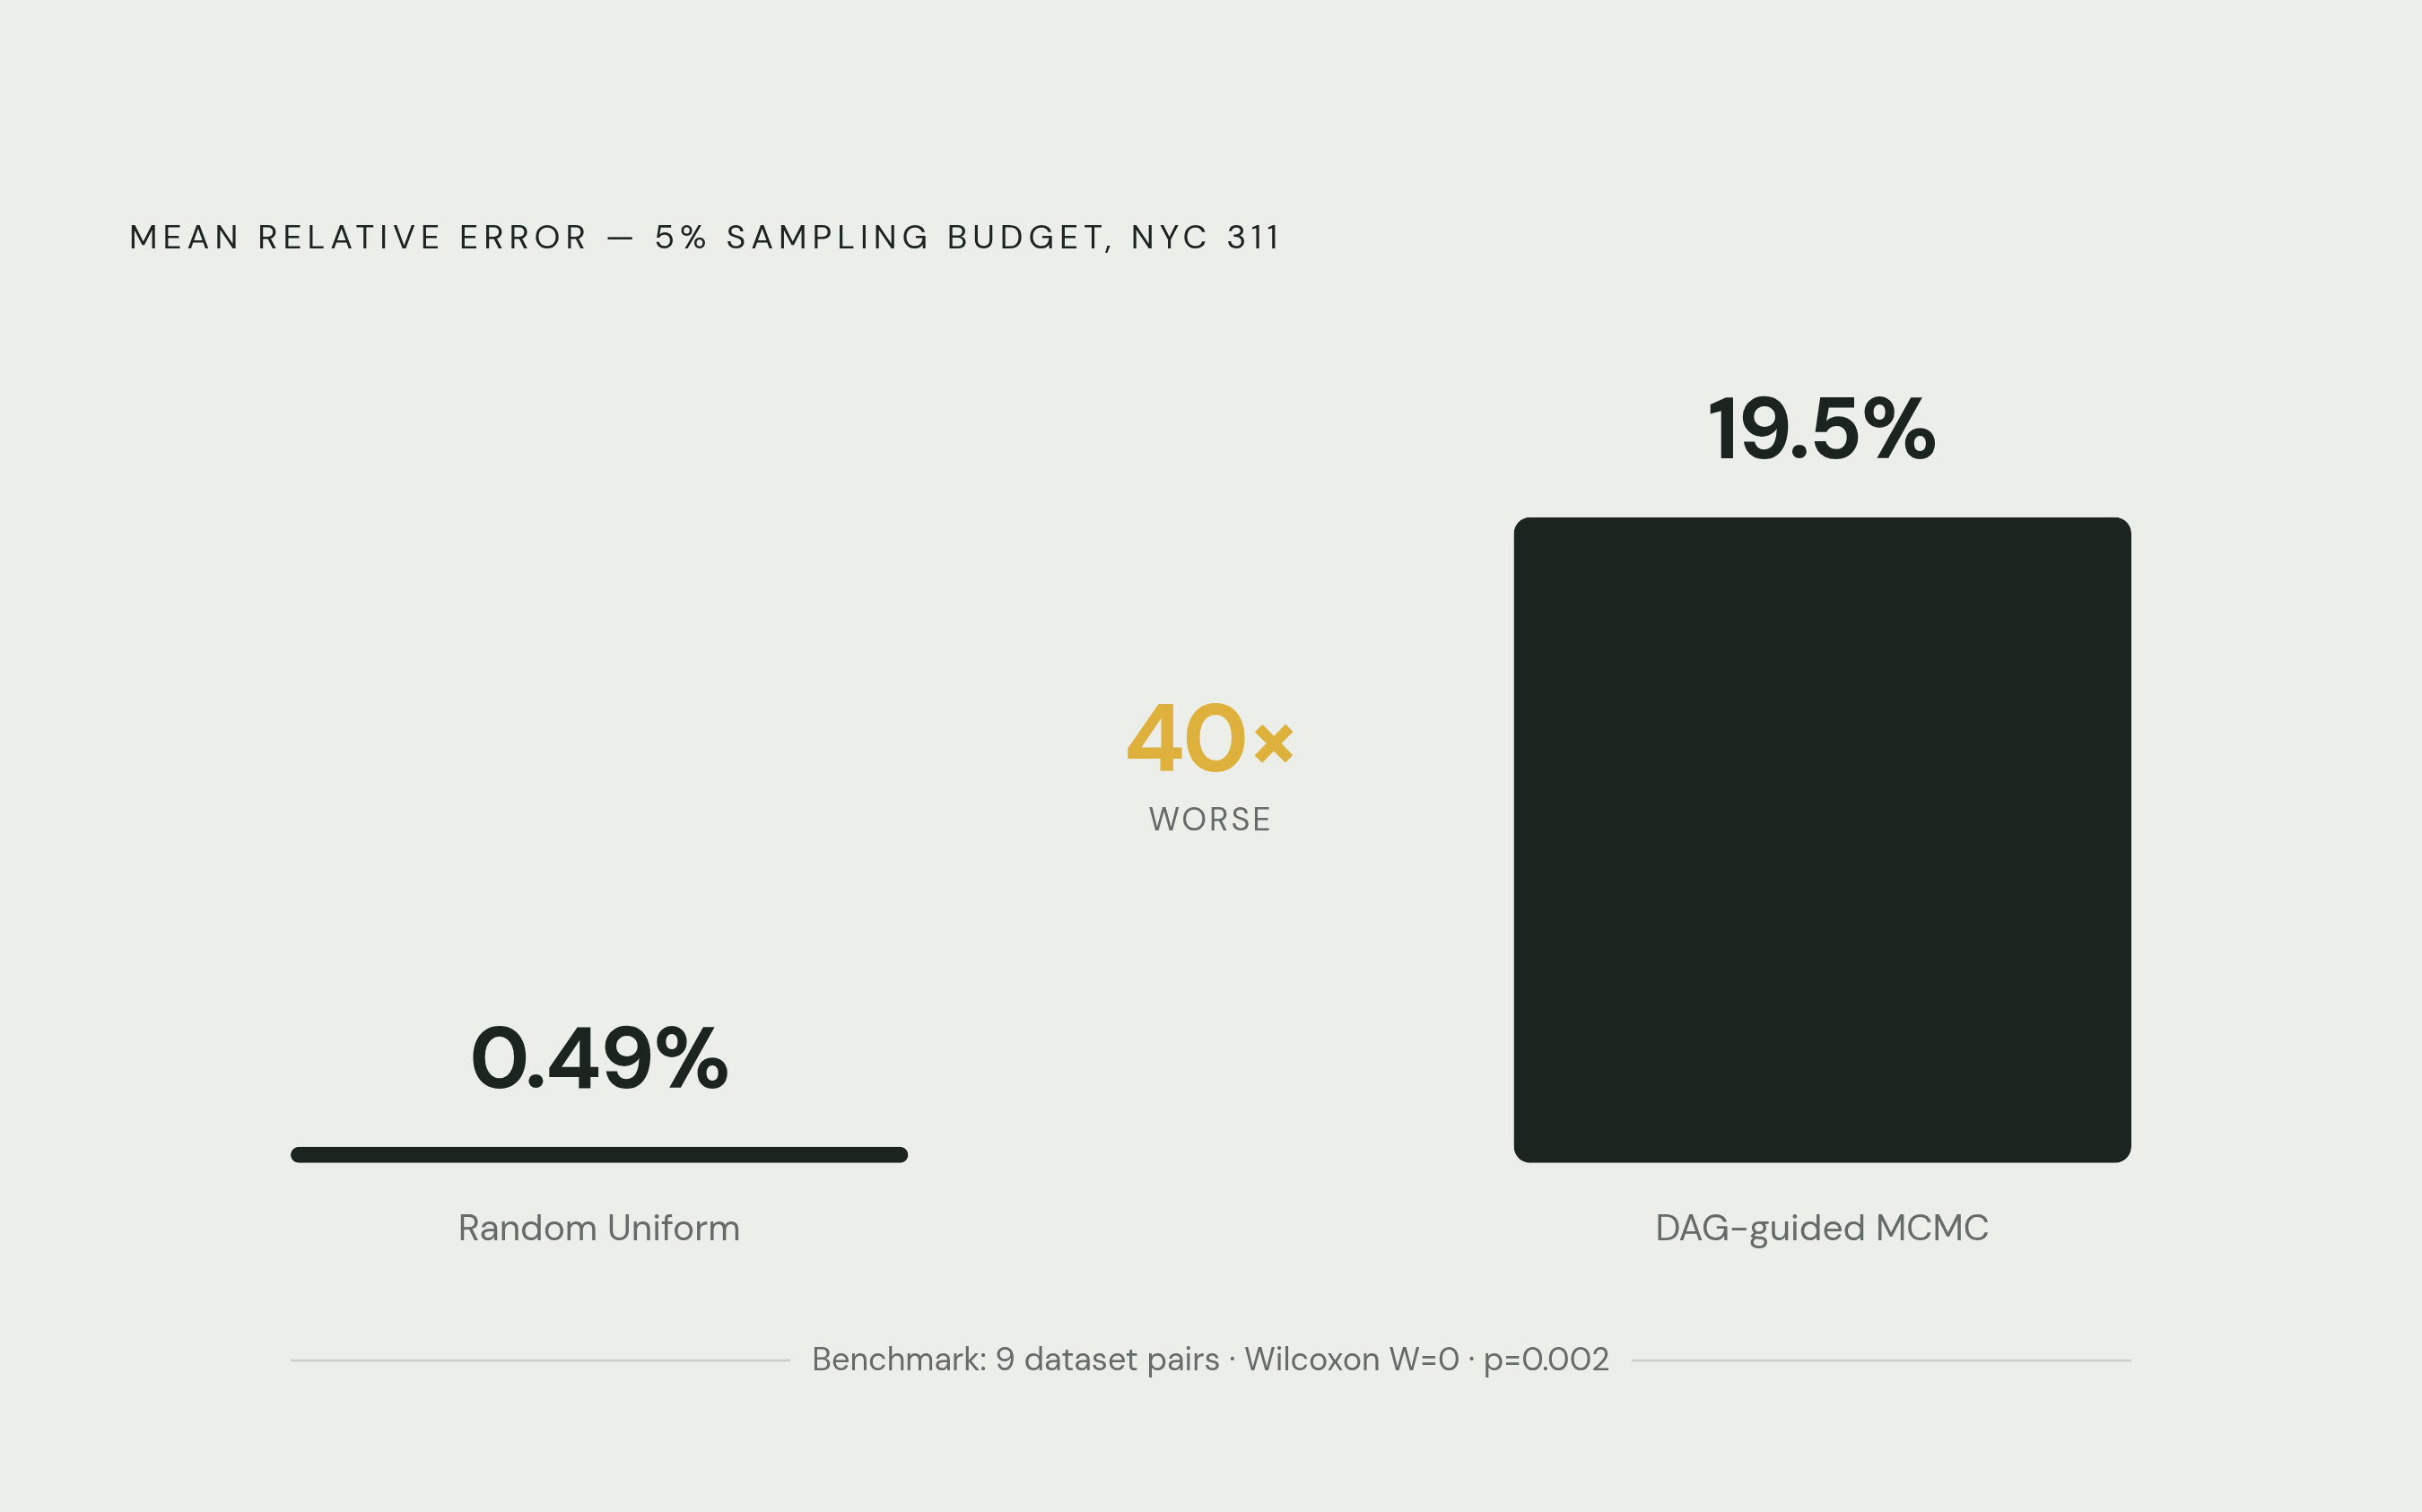
The benchmark numbers make the gap concrete. At a 5% sampling budget on the NYC 311 dataset, random uniform sampling produced a mean relative error of 0.49%. DAG-guided MCMC sampling, at the same 5% budget, produced 19.5% mean relative error, roughly 40 times worse. That's not a rounding difference; it separates a profile you can trust from one that misses most of what it was supposed to catch. Across the full set of real datasets in the benchmark, DAG-guided MCMC came in 11 to 49 times worse than random uniform sampling, a result confirmed statistically (Wilcoxon W=0, p=0.002, across nine independent dataset pairs). A sophisticated-sounding sampling method can be structurally blind to the exact column type where quality problems tend to hide.
High-cardinality categorical columns as a feature engineering hazard in ML pipelines
Knowing a column's cardinality before you encode it shapes whether your feature engineering works. One-hot encoding a low-cardinality column is trivial. One-hot encoding a high-cardinality column is how feature spaces explode.
The Criteo AdTech dataset makes the scale of the problem tangible. One million rows, 39 columns, 26 of them categorical, and those 26 categorical columns together contain 241,338 distinct categories. One-hot encode that dataset and you go from 39 dimensions to 241,351. That's not a marginal increase in compute cost; it's a fundamentally different modeling problem.
Most of those 241,351 dimensions carry almost no information, and that sparsity has real consequences for anything based on distance. K-nearest neighbors, clustering algorithms, anything that relies on a meaningful notion of "close" and "far" in feature space, loses its footing in a space that sparse, because nearly every pair of points looks equally far apart. Decision trees and random forests fail differently: when a category has only a handful of samples behind it, the model learns noise specific to those samples rather than a generalizable pattern, so generalization suffers on new data. None of this is a surprise to anyone who's built these pipelines before, but it's exactly the kind of hazard a cardinality profile flags before a single line of encoding code gets written, not after a model quietly underperforms in production.
The business cost of quality failures that cardinality profiling would have caught early
The dollar figures here are large enough that they stop sounding abstract. The Fivetran Enterprise Data Infrastructure Benchmark Report 2026 put average monthly business exposure from pipeline downtime at large enterprises at roughly $3 million, with 97% of respondents in that same report saying pipeline failures had slowed down their analytics or AI programs. That's not a fringe complaint, that's nearly universal.
The average enterprise in the report manages more than 300 pipelines, experiences 4.7 failures, and each failure takes close to 13 hours to resolve. The average enterprise in the report manages more than 300 pipelines, experiences 4.7 failures, and each failure takes close to 13 hours to resolve. More than half of engineering capacity, 53%, goes toward maintaining and troubleshooting existing pipelines rather than building anything new. That's an organization spending most of its engineering time firefighting rather than shipping.
The cost of poor data quality more broadly tells a similar story from a different angle. Chief operations officers rank data quality as their most significant data priority at a rate of 43%, and more than a quarter of organizations estimate annual losses reaching well into the millions from data quality problems, with 7% reporting losses several times higher still. Gartner's own estimate is a similar range, putting the average enterprise cost of poor data quality at $12.9 to $15 million a year. Cardinality drift, an unmapped new category value, a foreign key quietly going orphaned, a unique key that stops being unique, sits upstream of a meaningful share of these failures. Catching it at the profiling stage costs a query. Catching it after it's propagated into a dashboard or a model costs a lot more.
How modern data profiling tools handle cardinality analysis
Data profiling has become a core capability in the modern data quality stack, and the tools that do it well give business users, not just engineers, direct visibility into where a dataset is weak before that weakness turns into a downstream incident.
DataCleaner, an open-source profiling and cleansing tool, provides automatic exploratory data analysis out of the box, but it cannot retrieve median or distinct values for profiled data, a limitation that Pentaho Data Integration doesn't share. An IEEE comparative study found exactly this contrast: Pentaho returned both median and distinct values where DataCleaner did not. That's a concrete illustration of a broader point, that tool selection isn't a stylistic choice, it materially changes which cardinality signals an analyst can even see.
A more automated example of cardinality analysis in practice comes from the Astronomer profiling-tables agent skill, documented on mcpservers.org. It performs cardinality analysis specifically to distinguish categorical columns from high-cardinality ones and to flag skewed distributions, alongside assessing completeness through NULL rates, uniqueness through duplicate detection, and freshness through update timestamps. It generates column-level statistics tailored to the data type in question, which is the same principle underlying everything above: a categorical column and a numeric column need different questions asked of them, and a tool that treats them identically will miss what matters in each.
Integrating cardinality profiling into a DataOps pipeline as a continuous quality gate
There's a gap in how confident organizations feel about their own data versus how integrated they claim their data strategy is, and it's a wide one. Only 26% of chief data officers say they're confident their data can support new AI-enabled revenue streams, even though 81% report that their data strategy is now formally integrated with their technology roadmap. Strategy on paper and trust in the underlying data are clearly two different things, and cardinality profiling, treated as a continuous check rather than a one-time audit, is part of what closes that gap.
The defining feature of the shift toward combined DataOps and MLOps practices is automation: continuous checks that catch problems in real time and trigger a response, replacing periodic manual audits that only look backward. A cardinality gate built into that kind of pipeline does a handful of specific things. It profiles categorical columns on every pipeline run, not just once at ingestion. It keeps a baseline of the distinct-value set and alerts on any new value, any value that's disappeared, or any ratio shift past a threshold calibrated for that column. It surfaces those cardinality signals next to completeness and freshness metrics in one unified quality score, so a triage engineer doesn't have to check five separate dashboards to understand what broke. And for tables too large to scan exhaustively, it uses random uniform or cluster sampling rather than proxy-guided MCMC, because, as the benchmark data above shows, the wrong sampler will systematically miss the exact categorical defects the gate exists to catch.
Data contracts are the preventive half of this equation. Encoding expected cardinality ranges and valid value sets directly into a contract between a data producer and a data consumer means a domain violation becomes a contract violation, caught and rejected before it ever enters a downstream table. Profiling tells you something broke. A contract, backed by that same cardinality logic, stops the break before it happens.